
- Home
- About Us
- Mobile Applications
- Support
- Contact Us

Predicting race performance is not an exact science. There are number of models and methods available, each with its own merits as well as problems. Care should be employed when predicting or using race performance. The AeroRadar Application utilizes five models to predict comparable performance for typical race events:
The first four methods are based on actual race data (a distance and corresponding time), and uses the data to make the estimates, while the last one uses a known V̇O2 max value to do the predictions.
Because of the several prediction values one obtains from different models, the application recommends a range of values for each race distance. You can still see each predicted value by picking a distance. The value should be used as guidelines in estimating your performance, but should not be treated as unconditional values. Also, they should not be used to set training parameters, please see a discussion on this subject in Race vs Training Paces.
J.G. Purdy [4] developed a performance point system, which is calculated from a table of running performances compiled in 1936 called the Portuguese scoring Tables. The table lists distance and velocity from 40m to 100km. These velocities are assumed to be maximum possible velocity in a straight line. These performances were arbitrarily given a Purdy point of 950. World record times in 1970 have about 1035 Purdy points.
Later, Purdy [5] adapted the table to a least squares model, where Purdy establishes an equation for the "running curve" for men's world record performances (as of 1970). This allowed estimating performances using computations instead of using the Portuguese tables.
The Purdy points gives an indication of what a performance is worth for almost any distance, with comparable performances across distances being worth an equal number of points. The Purdy point system is exponential, thus the points increase rapidly with faster race time. See the comparison figure to see how the Purdy points relate to V̇O2 max and Daniel’s VDot.
The calculations in the AeroRadar Application are based on the C program kindly presented by Patrick Hoffman on Cross Country, Track, and Running Analysis [6].
Jack Daniel's et.al. [2] developed a fitness parameter labeled VDot that somewhat tracks the V̇O2 max. However, these two values may not match. The VDot is calculated from actual race data, and gives an indication of aerobic fitness level. In a way similar to the Purdy Point system, it standardizes performances from actual race data.
Daniels' model also has an equation to predict the lactic threshold pace. This pace is around the one we should train in the Zone 2 Anaerobic Conditioning. Visit the pages on Lactic Point and Training Zones for more information.
Daniel’s model does do a good job of predicting comparable performances for distances over 3km. Distances shorter than 3km do not rely on aerobic capacity nearly as much, thus they are better predicted by other models.
See the comparison figure to see how the Purdy points relate to V̇O2 max and Daniel’s VDot.
Dave Cameron [7] developed a model based on the top 10 times in the world at each distance, using them to compute comparable performances across distances. The speed vs. distance model works well for post-1945 records at 800m through 10k. From 1964 onward it also works well for the marathon.
Pete Riegel [3] developed a simple formula to predict performance, describing world record performances, and to be used to compare relative times of various groups of people for given race distance. It incorporates a “fatigue factor”, which varies for different groups. The AeroRadar Application uses an average factor of 1.055.
This model uses an actual test V̇O2 max, from which it back calculates Daniel’s VDot, and from this point it uses Daniel’s model to predict performance for the different race distances. In the calculation of VDot, the model assumes 10 min as the maximum time one can sustain a V̇O2 max pace, which is recommended by Martin, et.al. [1].
Purdy Points, V̇O2 max and VDot
The following figure shows the tracking relationship between Purdy Points, V̇O2 max and VDot. This figure was developed for different paces for 3km, but gives a general relationship for other distances.
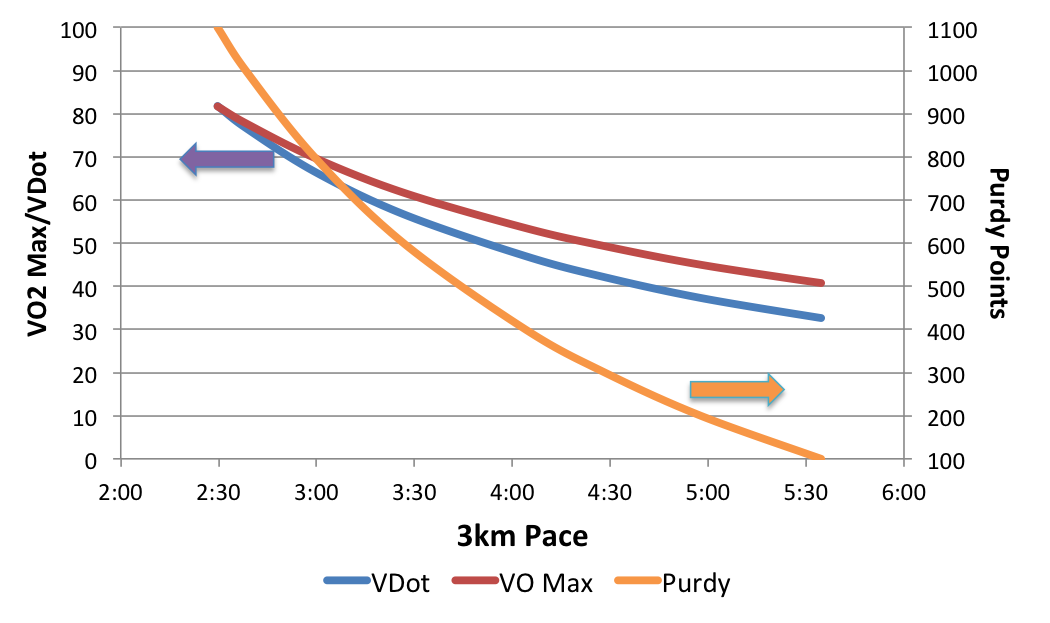
The Purdy Points change approximately ten to twenty times for each point change in V̇O2 max or VDot change.
Training all the time at race pace or V̇O2 max or VDot pace can cause premature body fatigue, without any significant fitness gains. You should plan your training to exercise in different proportions in all of the primary training zones. For most team sports, one trains typically at the V̇O2 max pace or faster around 20% to 25% of the time (or training distance).
One has to keep in mind that the predicted race times are based on an all out effort to win a race or improve one’s record. Continual training at the paces needed to meet the race time will cause unnecessary fatigue and may be detrimental to your fitness. It is better to train at different paces (or training zones), based on your sports’ needs.